

Read an experiment in this order
- Matrix: see which tasks passed or failed across treatments and agents, alongside cost and duration.
- Comparisons, below the Matrix grid: check which differences hold up across tasks and read the Brief on frictions seen with the side that did worse.
- Frictions: prioritize the recurring problems blocking agents and see where to fix each one.
- Runs & Evals: open failed or slow runs to inspect which rubric criteria failed on the Evals tab before reading Traces.
Pass rate and lift
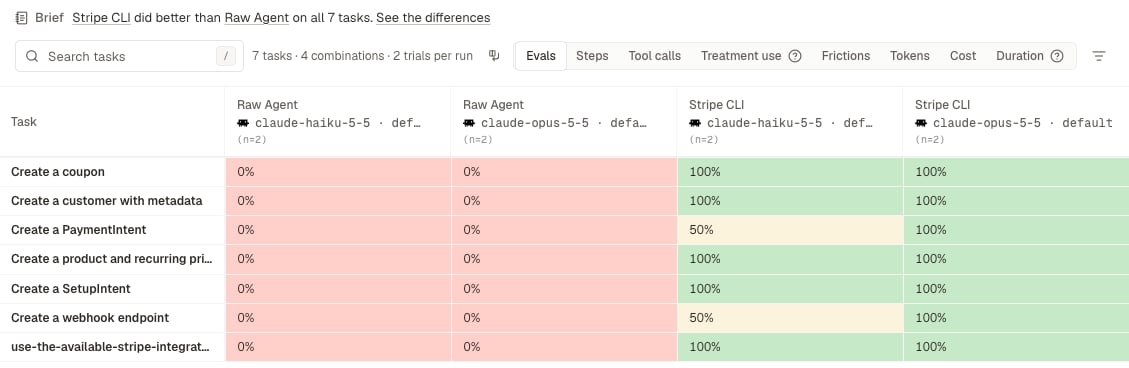
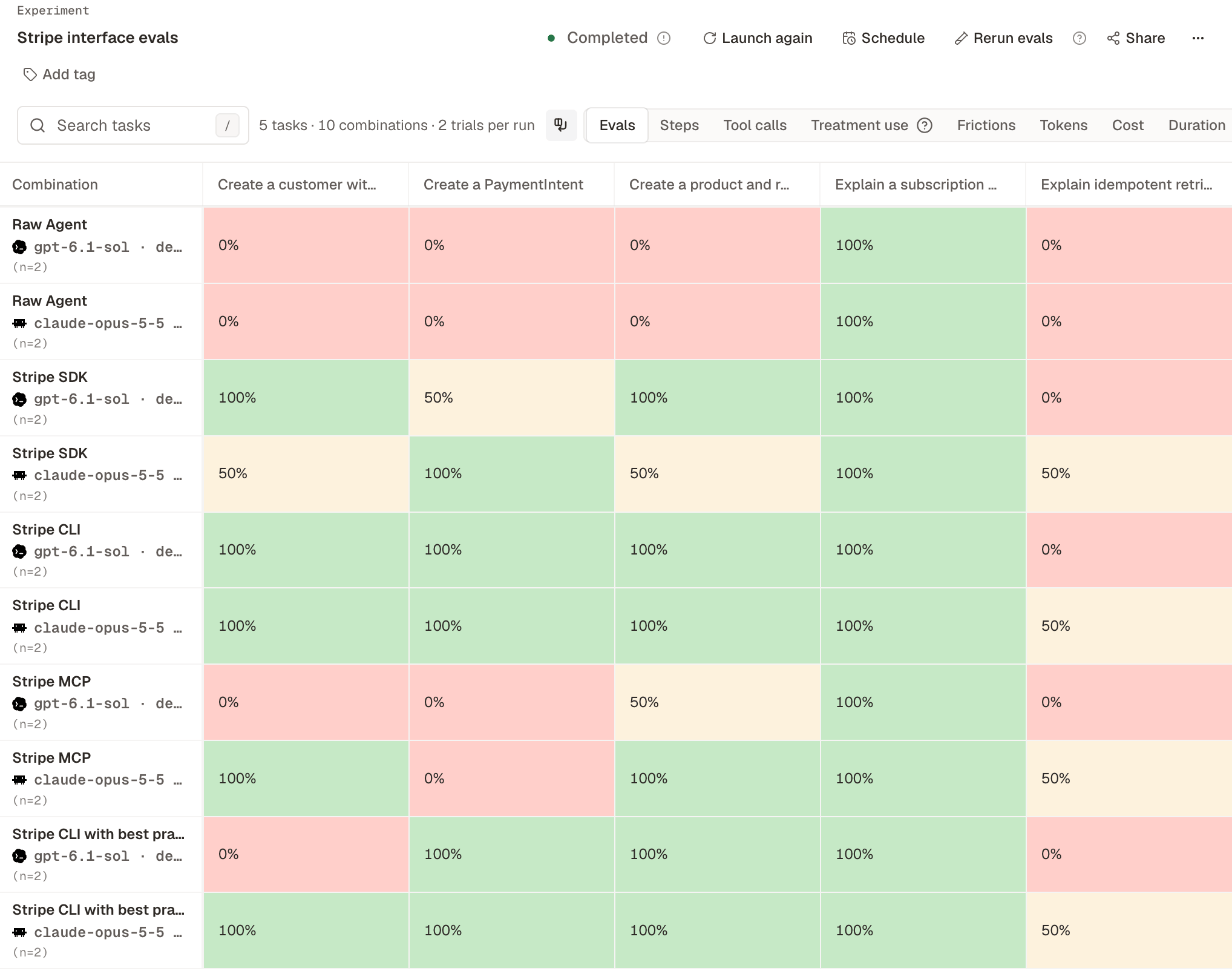
Pass rate is the percentage of scored runs that passed the task’s rubric in Evals (blocked runs have no verdict and are excluded; see setup and machine errors if runs could not start). Because each trial is a separate run, repeating trials steadies each cell’s pass rate. Lift is the difference in pass rate between a treatment and the baseline you selected at launch. Matrix displays raw pass rates rather than a lift column, so compare cells side by side:- Set Matrix metric to Evals.
- Compare the treatment’s cell and the baseline’s cell on the same task and agent, hovering for exact trial counts.
Matrix
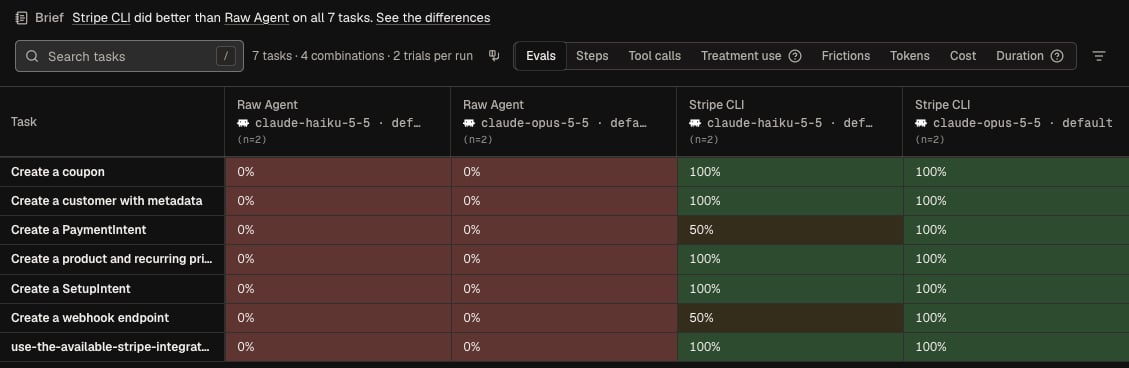
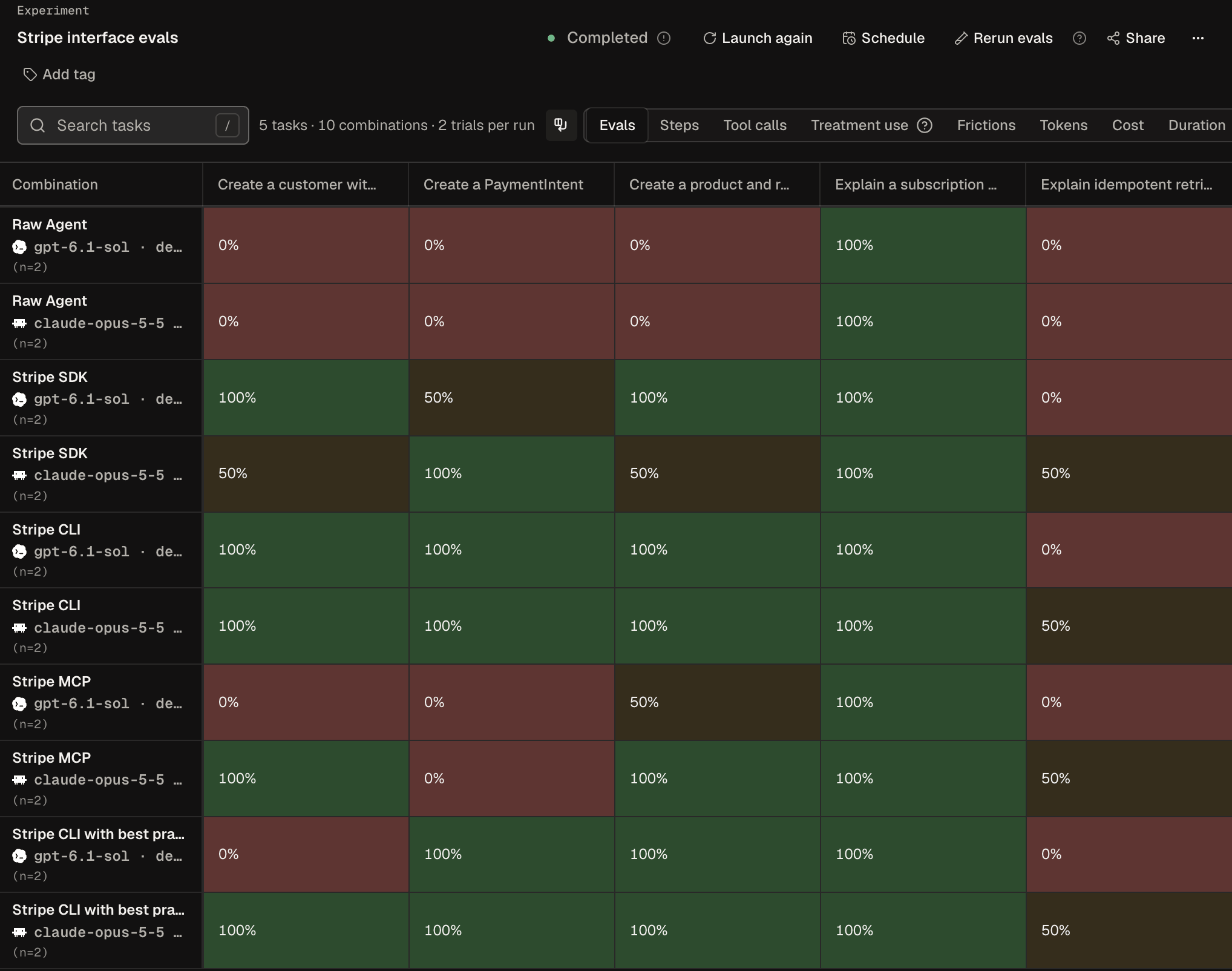
Matrix maps tasks against agent-and-treatment combinations as a heat map. Switch Matrix metric to inspect different dimensions across all trials in each cell:
Hover over any cell for exact trial counts or min/max/spread statistics; a
* marks incomplete trials or missing metrics (see Evals or Insights troubleshooting). Filter the grid by task, Evals verdict, treatment, or agent, or select Transpose to swap rows and columns.
Above the grid, a one-line banner summarizes the Comparisons outcome. Its link expands Comparisons below the grid and scrolls to it.
Runs
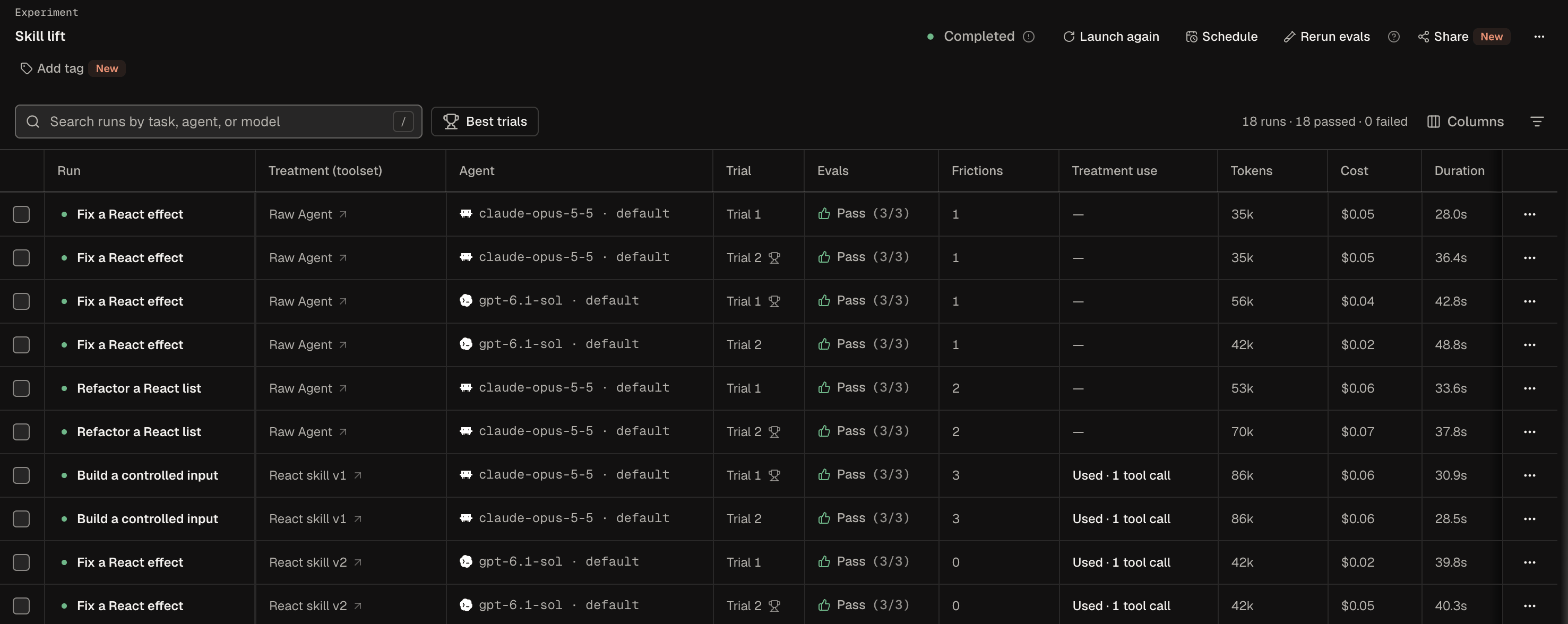
Runs lists every run with its task, treatment, agent, trial, Evals result, and Treatment use status (Run profile). Filter by Evals, Status, Treatment (toolset), Agent, or toggle Best trials to keep only the top trial per combination.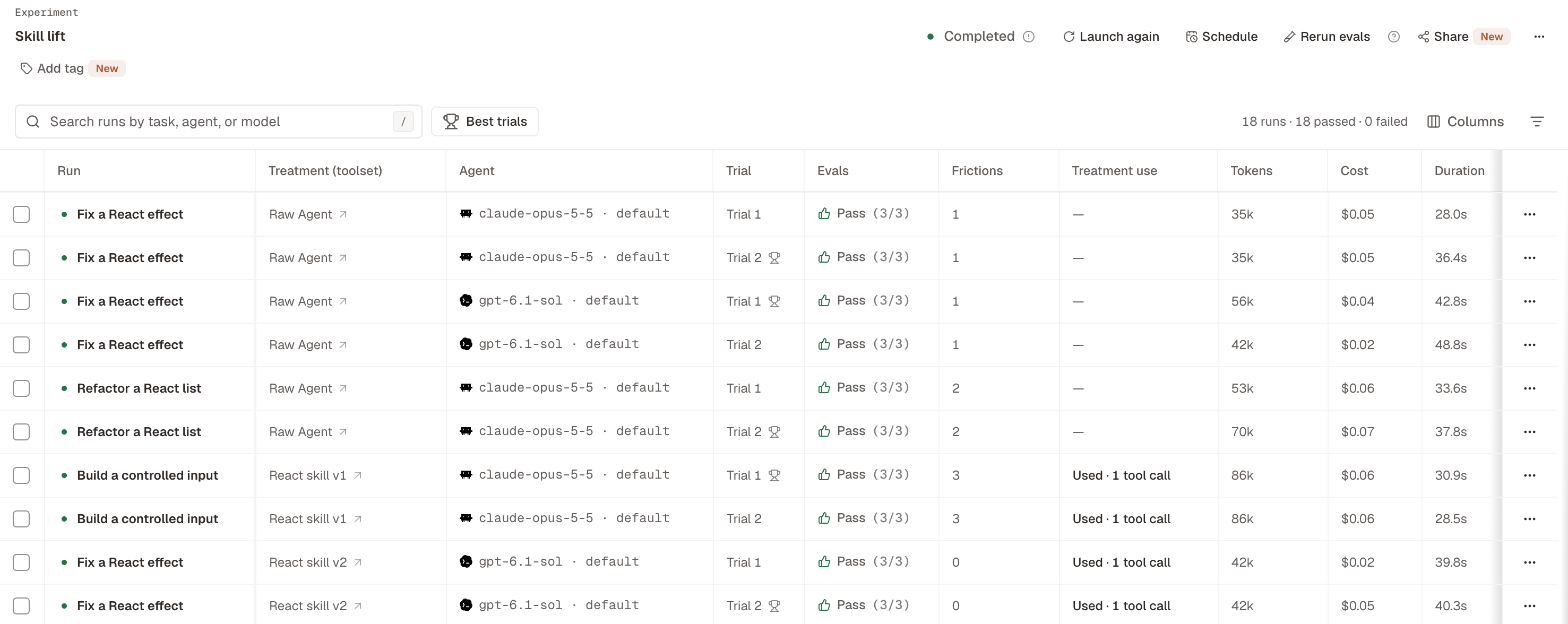
Compare runs side by side
Select two or three runs in Runs (or select Compare inside an open run) to inspect their Traces, Output, Evals, and Run profile side by side across columns.Find results across the project
Use the Analyze group in the sidebar to inspect results across every experiment in the project:
You can also ask Ask Oqo or your AI assistant via the Oqoqo Plugin to summarize any experiment.
From the CLI and the plugin
Next steps
Comparisons
Verify which differences hold up and read the Brief.
Frictions
Rank and fix the problems stopping agents.
Run details
Inspect step-by-step traces, outputs, and diffs.
Evals
See how rubric verdicts are scored.