

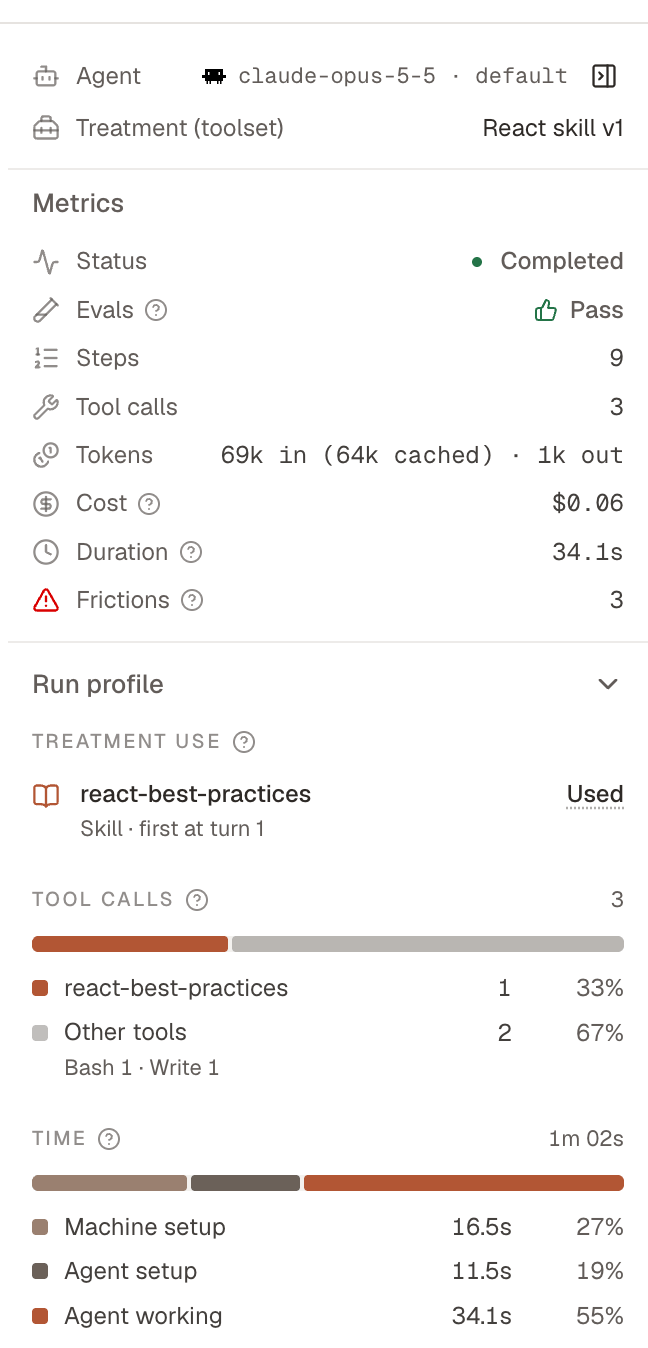
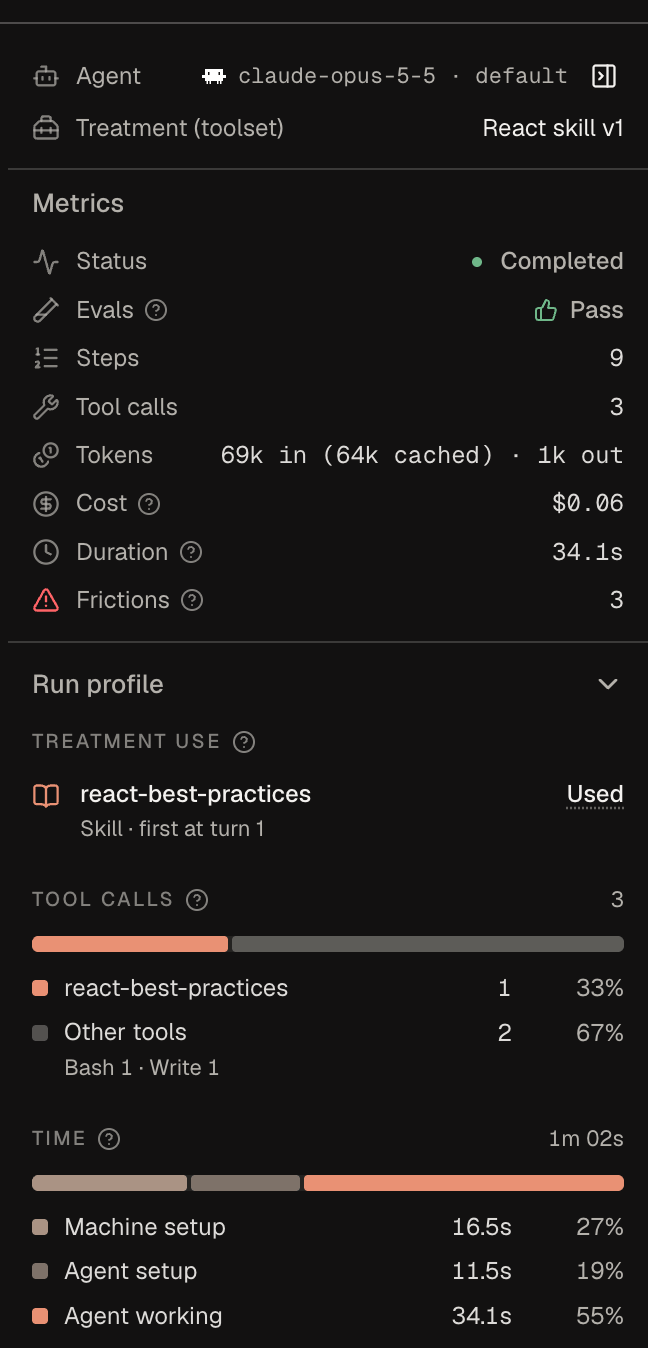
Treatment use
Treatment use tracks each skill, MCP server, CLI, or SDK in the treatment (and rolls up to one state per run on the Runs list):
Oqoqo detects Used when an agent reads a skill file or calls its skill tool, calls an MCP server tool, or invokes a CLI command (or any binary installed by an exact npm/crates.io/Go CLI package) directly in a shell call. Not used is an observation, not a pass/fail verdict.
Tool calls
Tool calls groups every call the agent made by what served it—each launched skill, MCP server, or CLI, or Other tools. Calls matching multiple tools are excluded from individual totals and flagged in Evidence warnings.What stood out
What stood out highlights notable execution patterns that cross fixed thresholds, linking directly to the matching turn or step in Traces:- Repeated identical tool calls with the same input
- Single-turn context growth of at least 10,000 tokens and 10%
- Slow tool calls taking at least 5 seconds and 5% of agent working time
- Gaps between turns of at least 10 seconds and 3× the run’s median gap (when not explained by a slow tool call)
Time
Time breaks the run into recorded phases (hiding phases with no recorded duration, or noting if overlapping phases cannot be split):
Token totals and USD cost appear alongside timing (unreported costs stay blank rather than showing
$0).
When the profile cannot answer
Once the run finishes, if logs are missing, incomplete, or ambiguous, Evidence warnings states exactly what could not be verified—for example, no readable agent log, missing launch metadata, unattributed calls, or calls matching multiple tools—without guessing causes. If a CLI shows Can’t tell, list its executable names under Commands; if a tool shows Not used, see Measure a tool’s impact.From the CLI and the plugin
Next steps
Evals
See how Evals grade runs against task rubrics.
Frictions
Identify recurring issues across runs.
Measure a tool's impact
Combine Treatment use and Matrix lift to judge a tool.
oqoqo runs and results
Inspect run profiles from the terminal.