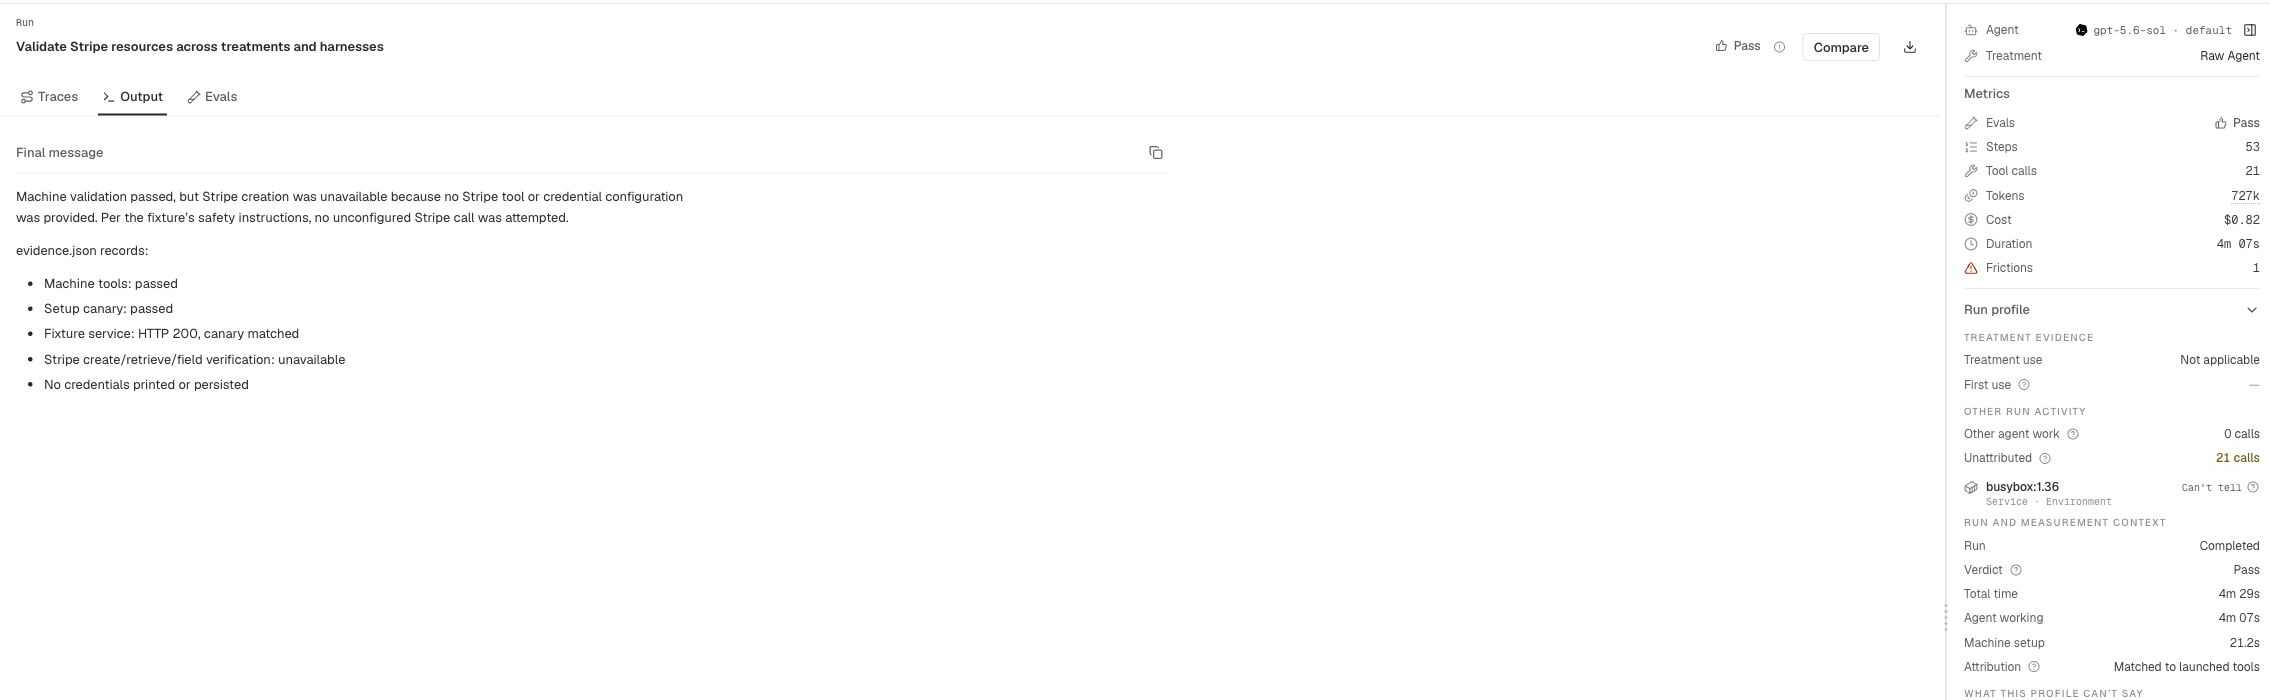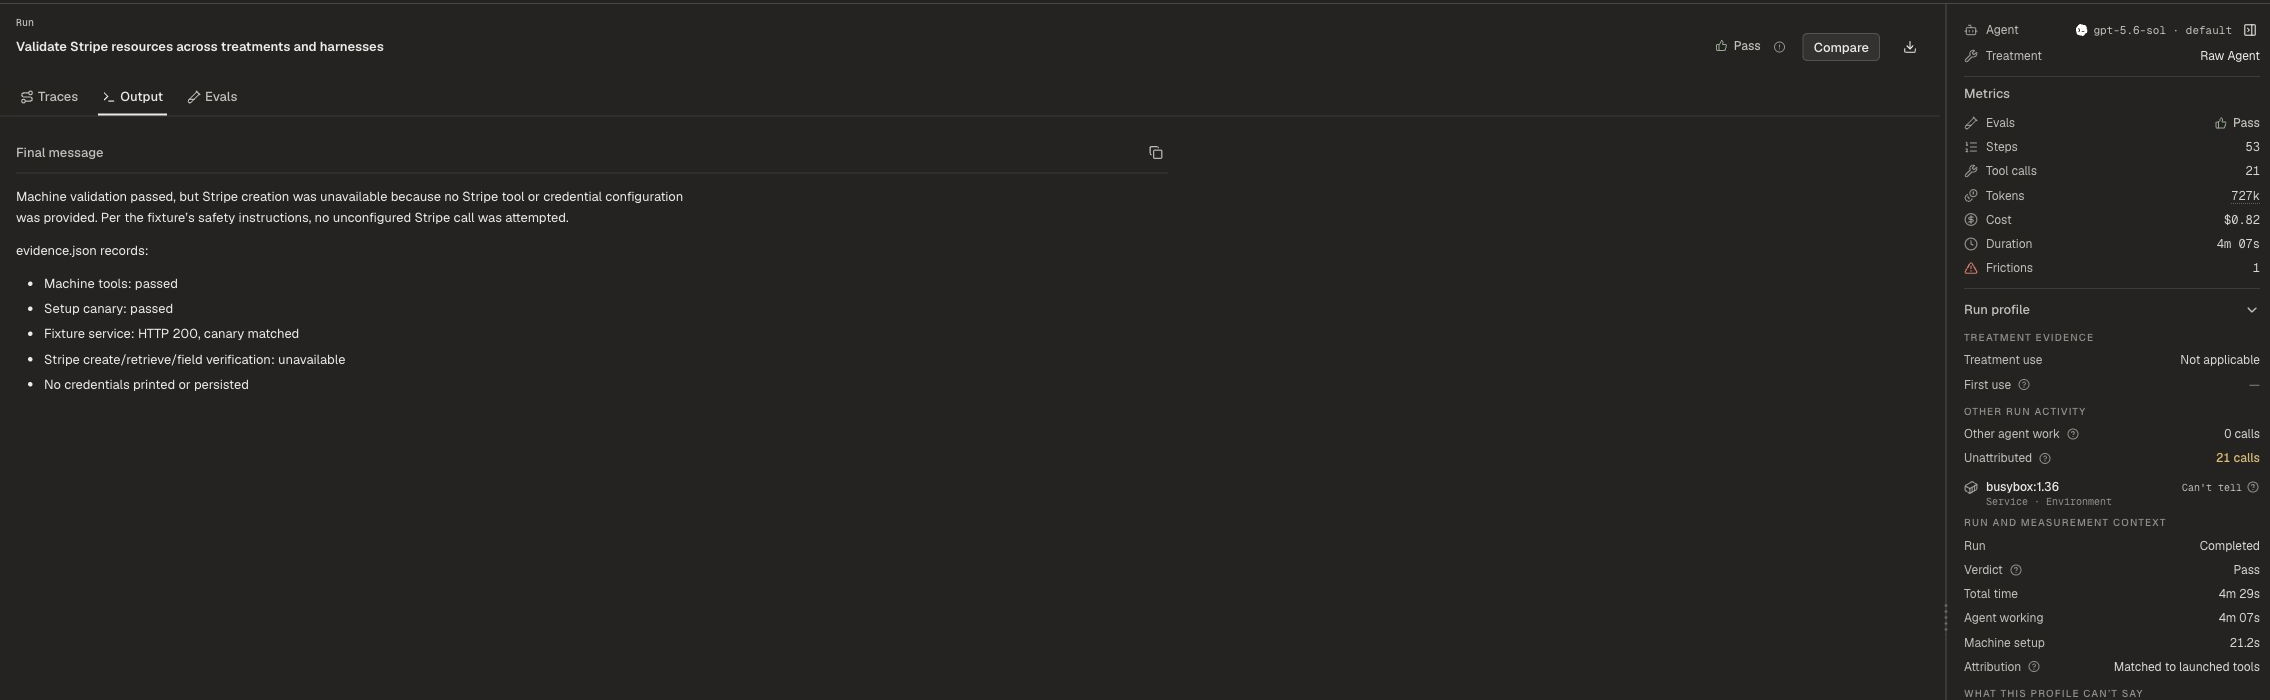

When an agent runs in Oqoqo, every action it takes is recorded. That record is the trace — a numbered, step-by-step log of the complete trajectory from the initial instruction to the final answer. Traces are the primary diagnostic tool for understanding agent behavior: not just what the agent did, but what it encountered, where it struggled, and why it made each decision.

What a trace contains

A trace captures the full context of a trial run. Each step in the trace is one of the following:

Instructions and responses

The original task instruction and the agent’s initial response before it starts working.

Tool calls and results

Every tool invoked — bash, fs.read, fs.edit, browser.click, search, and others — along with success (✓) or failure (✗) markers and the returned output.

Errors and stack traces

Full error messages and stack traces at the exact step they occurred.

Reasoning hook entries

The agent’s stated reasoning at each decision point — the “why” behind each action, not just the “what.”

Files read and written

Every file the agent accessed or modified, including the content before and after changes.

Recovery and stopping point

The exact step where the agent recovered from an error — or stopped trying.

Trace format

Traces are stored as traces.jsonl in the trial workspace. Each line is a JSON object representing one step in the trajectory.
{"step": 1, "role": "instruction", "content": "Refactor auth so require() stays deterministic across larger graphs."}
{"step": 2, "role": "assistant", "content": "I'll inspect the module cache before touching the resolver."}
{"step": 3, "role": "tool", "name": "bash", "calls": [{"cmd": "read auth.ts", "status": "ok"}, {"cmd": "grep usages", "status": "ok"}]}
{"step": 4, "role": "tool", "name": "fs.edit", "calls": [{"file": "auth.ts", "status": "error", "message": "TypeError: cannot read 'config'"}]}
You can download traces.jsonl directly from the trial workspace or access it via the API for custom analysis.

Viewing traces in the UI

Open the Traces tab for any trial to see the full numbered step list. Each step is expandable to reveal the complete content — tool inputs, outputs, error messages, and reasoning entries.
#1  Instruction    Refactor auth so require() stays deterministic
                   across larger graphs.

#2  Assistant      I'll inspect the module cache before touching
                   the resolver.

#3  Tool · bash    ✓ read auth.ts · ✓ grep usages

#4  Tool · fs.edit ✗ edit auth.ts — TypeError: cannot read 'config'
Steps with failures are highlighted so you can jump directly to the point where things broke down. From there, you can expand the surrounding steps to read the full context.

The reasoning hook

The reasoning hook captures the agent’s thinking at each decision point throughout the run. Where a standard trace tells you what the agent did, the reasoning hook tells you why it chose that action. This is especially useful for understanding:
  • Why the agent picked one tool over another
  • What the agent believed about the environment before a failing step
  • Whether the agent recognized an error and adapted, or continued on a broken path
Reasoning hook entries appear inline with the trace, annotated at the step where they were recorded. Look for them when a failure is surprising — the agent’s stated reasoning often reveals the misunderstanding that led to the error.

Exporting traces

Every trial’s traces.jsonl is available for download from the trial workspace. You can also access traces programmatically via the Oqoqo API. Use exported traces to:
  • Run custom analysis or scoring pipelines
  • Feed results back into your agent loop
  • Build dashboards over token use, error patterns, or tool call distributions
  • Archive experiment results outside of Oqoqo
Traces are stored in the trial workspace alongside answer.md (the agent’s final answer) and the file diff for that trial.

Asking questions about a trace

Use the built-in Chat feature to ask questions about any trace. Chat is grounded in the trace content, so answers are specific to that trial’s actual steps and outputs. Example questions you can ask:
  • “Why did the agent retry at step 8?”
  • “What caused the failure at step 12?”
  • “Which tool did the agent call most often?”
  • “Did the agent read the config file before editing it?”
  • “At what point did the agent stop making progress?”
Chat is useful when a trace is long and you want to navigate directly to the relevant context without reading every step manually.
Read traces from failed trials first. The step where a ✗ appears is usually where your agent-facing interface has a friction point — a name mismatch, a type error, or a missing example that caused the agent to guess wrong.